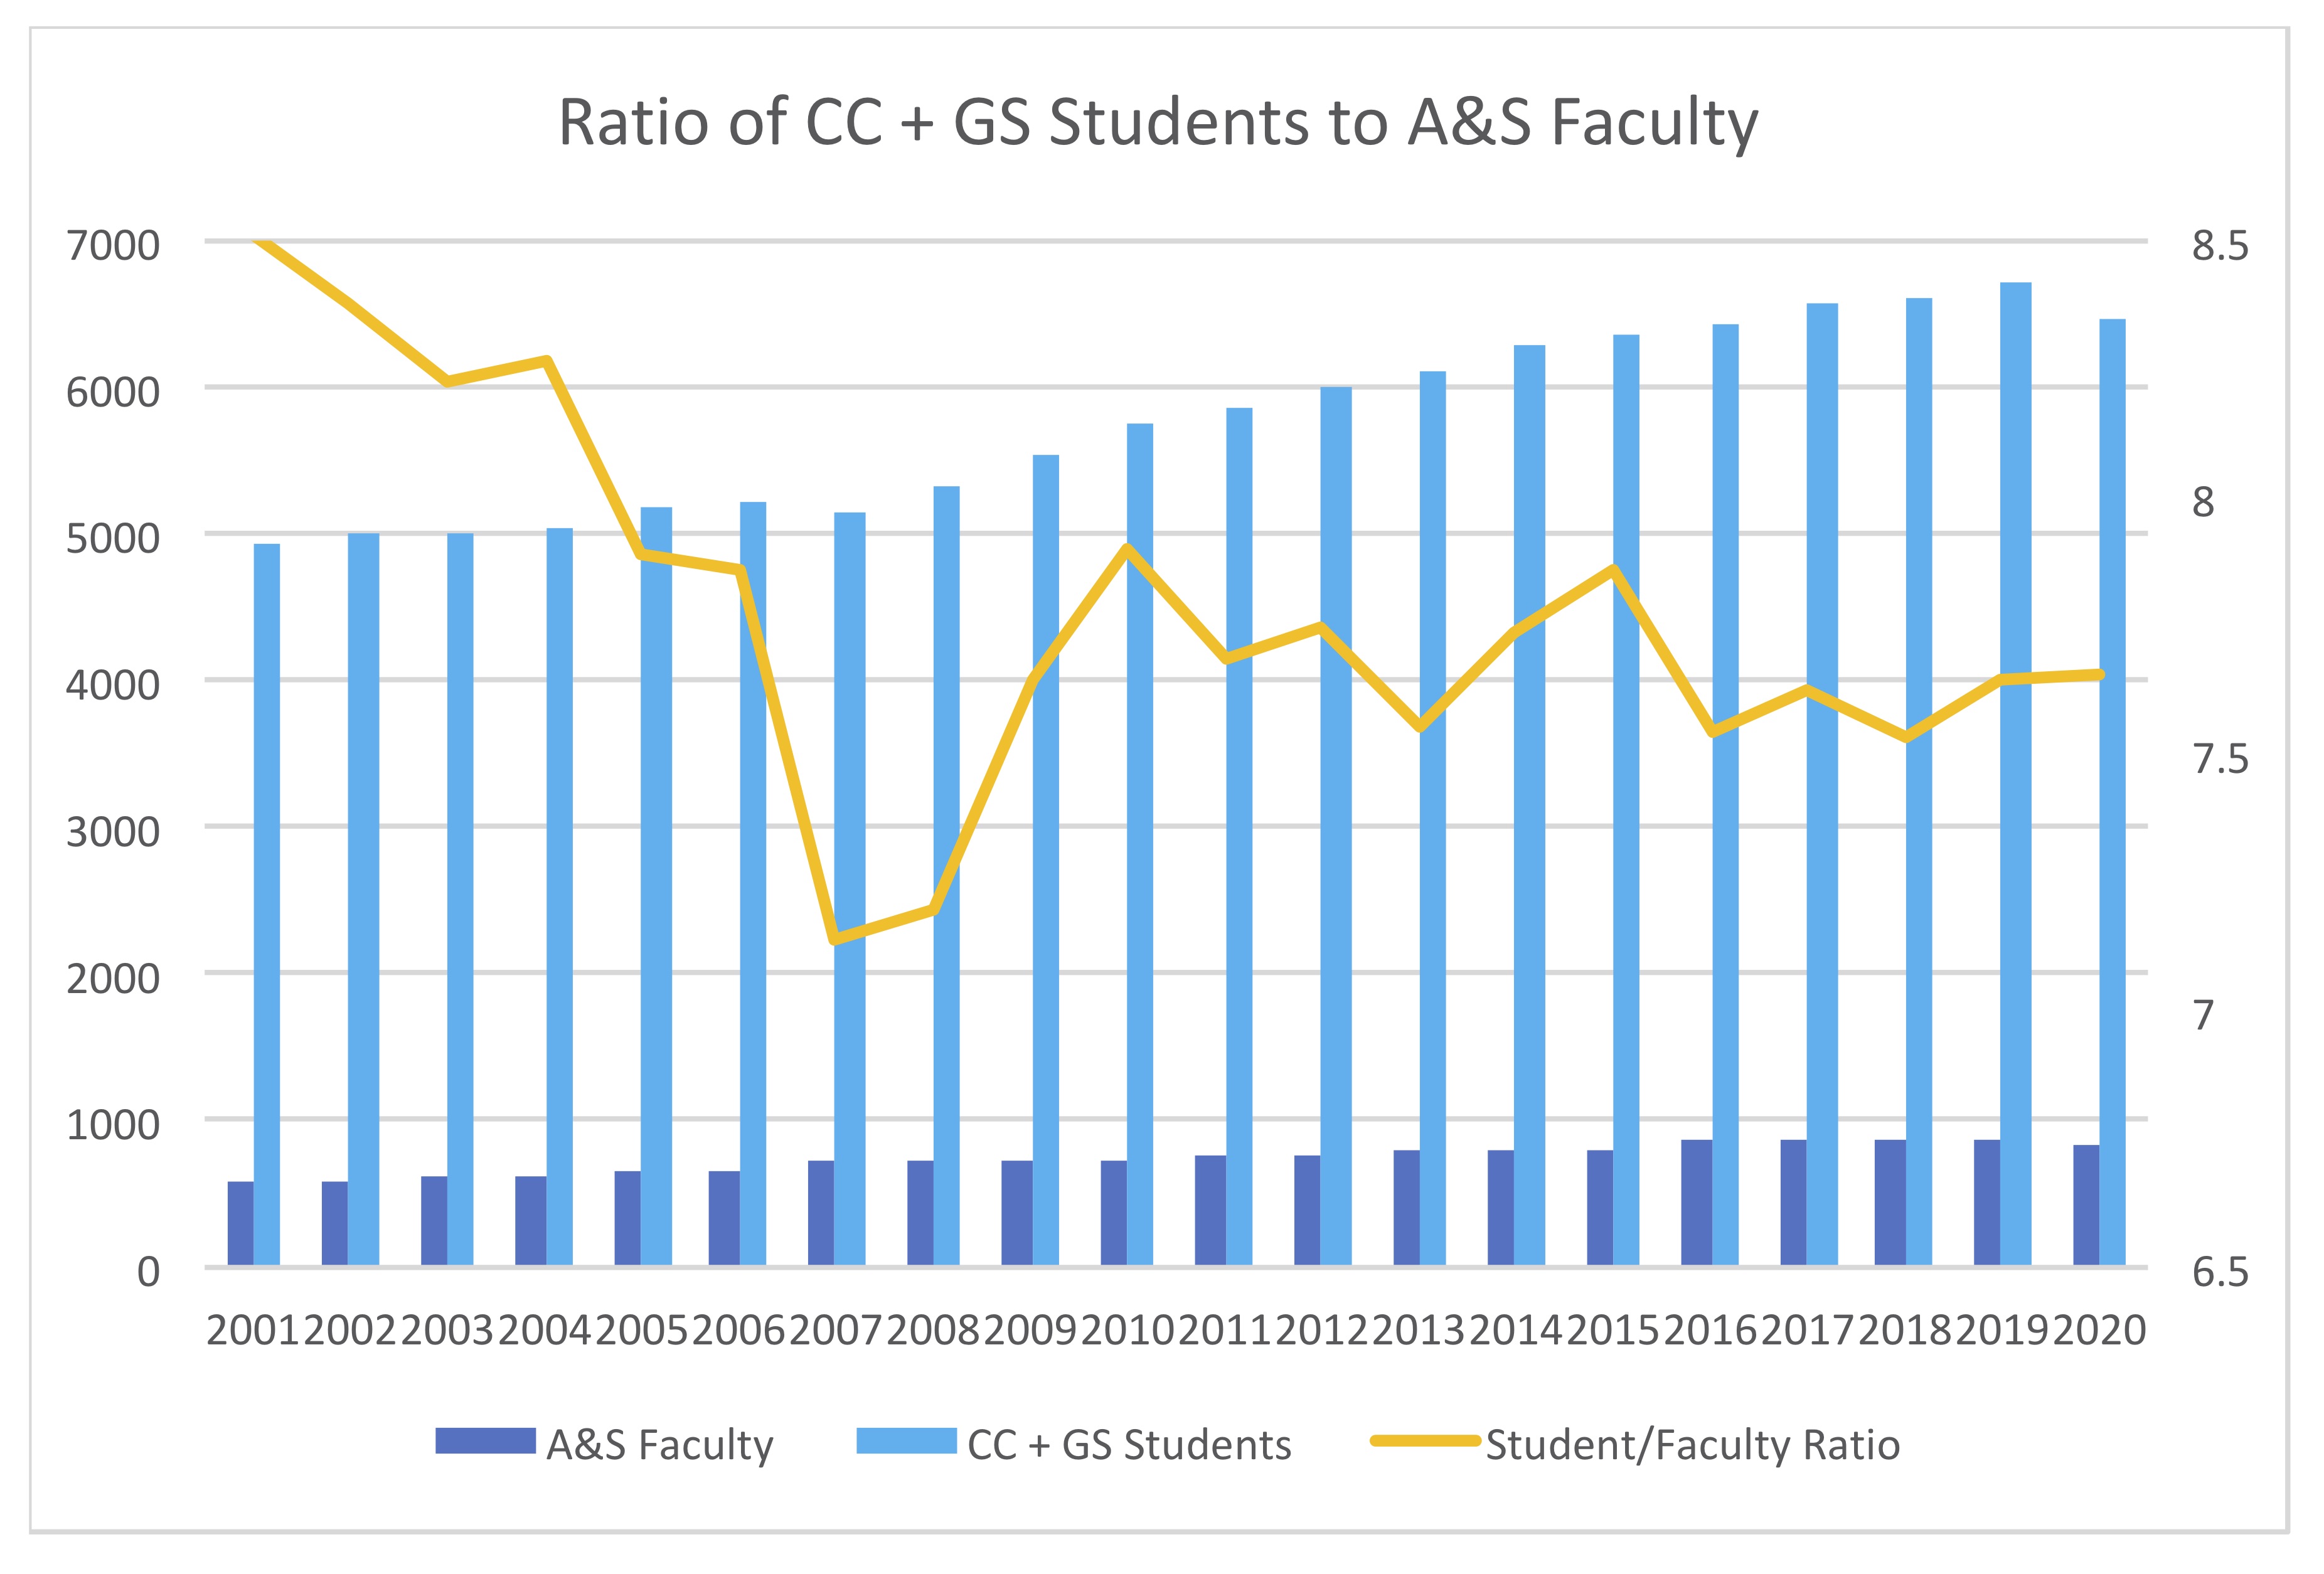
| Year | A&S Fac. | CC+GS Stud. | Ratio | Humanities | Nat.Sci. | Soc. Sci. | CC (FTE) | GS (FTE) |
| 2001 | 578 | 4920 | 8.5 | 242 | 196 | 140 | 4073 | 847 |
| 2002 | 596 | 4994 | 8.4 | 253 | 199 | 144 | 4106 | 888 |
| 2003 | 609 | 5009 | 8.2 | 262 | 198 | 149 | 4163 | 846 |
| 2004 | 611 | 5052 | 8.3 | 262 | 197 | 152 | 4129 | 923 |
| 2005 | 657 | 5184 | 7.9 | 302 | 192 | 163 | 4210 | 974 |
| 2006 | 666 | 5234 | 7.9 | 294 | 203 | 169 | 4204 | 1030 |
| 2007 | 722 | 5154 | 7.1 | 329 | 218 | 175 | 4173 | 981 |
| 2008 | 740 | 5327 | 7.2 | 337 | 219 | 184 | 4238 | 1089 |
| 2009 | 724 | 5536 | 7.6 | 315 | 224 | 185 | 4367 | 1169 |
| 2010 | 728 | 5752 | 7.9 | 312 | 230 | 186 | 4467 | 1285 |
| 2011 | 762 | 5854 | 7.7 | 323 | 246 | 193 | 4541 | 1313 |
| 2012 | 776 | 6012 | 7.7 | 333 | 254 | 189 | 4582 | 1430 |
| 2013 | 809 | 6111 | 7.6 | 345 | 263 | 201 | 4586 | 1525 |
| 2014 | 814 | 6297 | 7.7 | 357 | 260 | 197 | 4652 | 1645 |
| 2015 | 810 | 6365 | 7.9 | 364 | 252 | 194 | 4622 | 1743 |
| 2016 | 854 | 6439 | 7.5 | 377 | 268 | 209 | 4637 | 1802 |
| 2017 | 861 | 6563 | 7.6 | 379 | 271 | 211 | 4657 | 1906 |
| 2018 | 877 | 6611 | 7.5 | 392 | 274 | 211 | 4663 | 1948 |
| 2019 | 878 | 6710 | 7.6 | 379 | 288 | 211 | 4680 | 2030 |
| 2020 | 845 | 6471 | 7.7 | 368 | 282 | 195 | 4458 | 2013 |
Note: Faculty numbers are counts of full-time A&S faculty excluding Arts, SIPA, and SPS (that is, Humanities + Natural Sciences + Social Sciences). These are the most relevant faculty numbers, as they count those faculty who normally teach full-time undergraduates. Student numbers are FTEs of students in the A&S colleges, namely CC + GS.
Links to Sources
Faculty 2002-11: http://web.archive.org/web/20120927063300/http://www.columbia.edu/cu/opir/abstract/opir_faculty_history_1.htm
Faculty 2011-20: https://opir.columbia.edu/sites/default/files/content/Statistical%20Abstract/opir_faculty_history.pdf
Students: Same as Figure 6