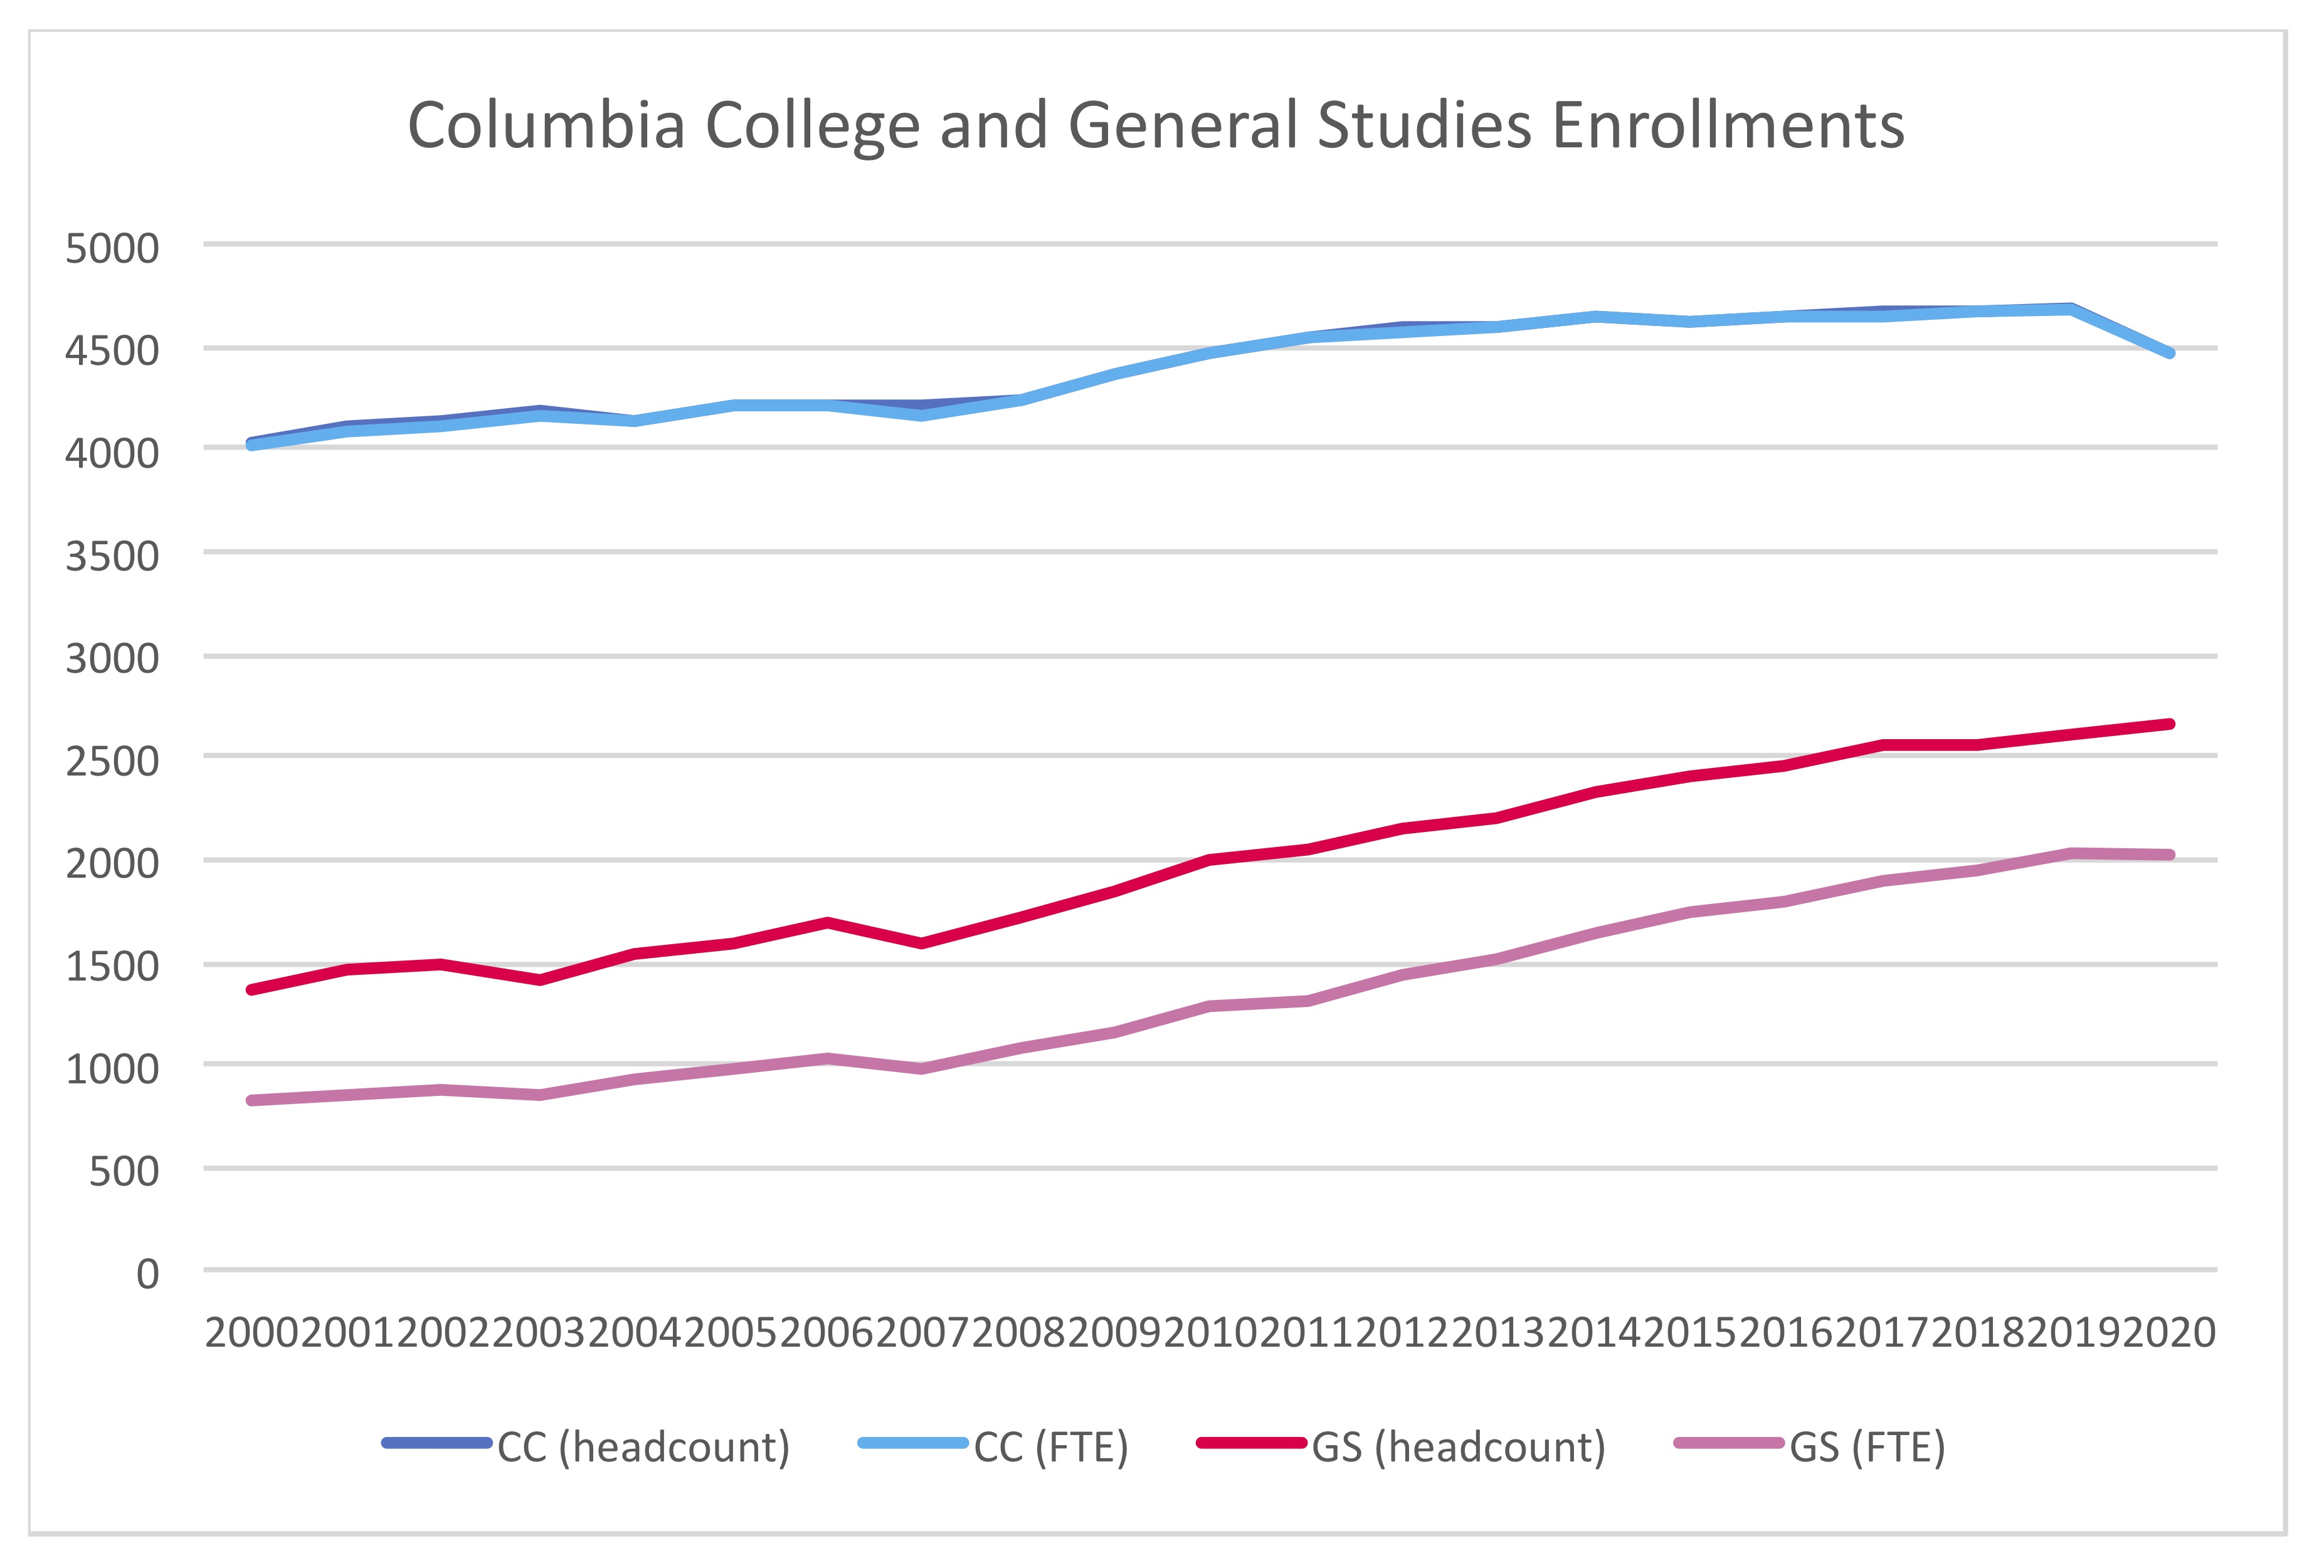
| Year | CC (headcount) | CC (FTE) | GS (headcount) | GS (FTE) | ||
| 2000 | 4031 | 4018 | 1364 | 825 | ||
| 2001 | 4109 | 4073 | 1465 | 847 | ||
| 2002 | 4141 | 4106 | 1485 | 888 | ||
| 2003 | 4188 | 4163 | 1422 | 846 | ||
| 2004 | 4144 | 4129 | 1550 | 923 | ||
| 2005 | 4224 | 4210 | 1597 | 974 | ||
| 2006 | 4212 | 4204 | 1685 | 1030 | ||
| 2007 | 4217 | 4173 | 1584 | 981 | ||
| 2008 | 4247 | 4238 | 1710 | 1089 | ||
| 2009 | 4376 | 4367 | 1856 | 1169 | ||
| 2010 | 4475 | 4467 | 2000 | 1285 | ||
| 2011 | 4550 | 4541 | 2038 | 1313 | ||
| 2012 | 4587 | 4582 | 2161 | 1430 | ||
| 2013 | 4593 | 4586 | 2213 | 1525 | ||
| 2014 | 4657 | 4652 | 2319 | 1645 | ||
| 2015 | 4627 | 4622 | 2394 | 1743 | ||
| 2016 | 4644 | 4637 | 2449 | 1802 | ||
| 2017 | 4667 | 4657 | 2545 | 1906 | ||
| 2018 | 4670 | 4663 | 2568 | 1948 | ||
| 2019 | 4686 | 4680 | 2617 | 2030 | ||
| 2020 | 4461 | 4458 | 2660 | 2013 | ||
Notes: All figures refer to Fall semesters. "Headcount" means total number of students, both full-time and part-time; "FTE" means full-time equivalents, which is calculated by the Provost's office as the number of full-time students plus one-third the number of part-time students. For Columbia College, these figures are nearly identical, since there are hardly any part-time students. When there was a discrepancy between different sources, the later source was used. In no case was any discrepancy greater than a few dozen; these small variations are perhaps due to fluctuation during the semester.
Sources: 2000, 2001, 2002, 2003, 2003-05, 2005-08, 2005-10, 2011, 2012, 2013, 2014, 2015, 2016, 2017, 2018, 2019, 2020; also 1999-2003 (headcount only), 2002-11 (headcount only).