|
|
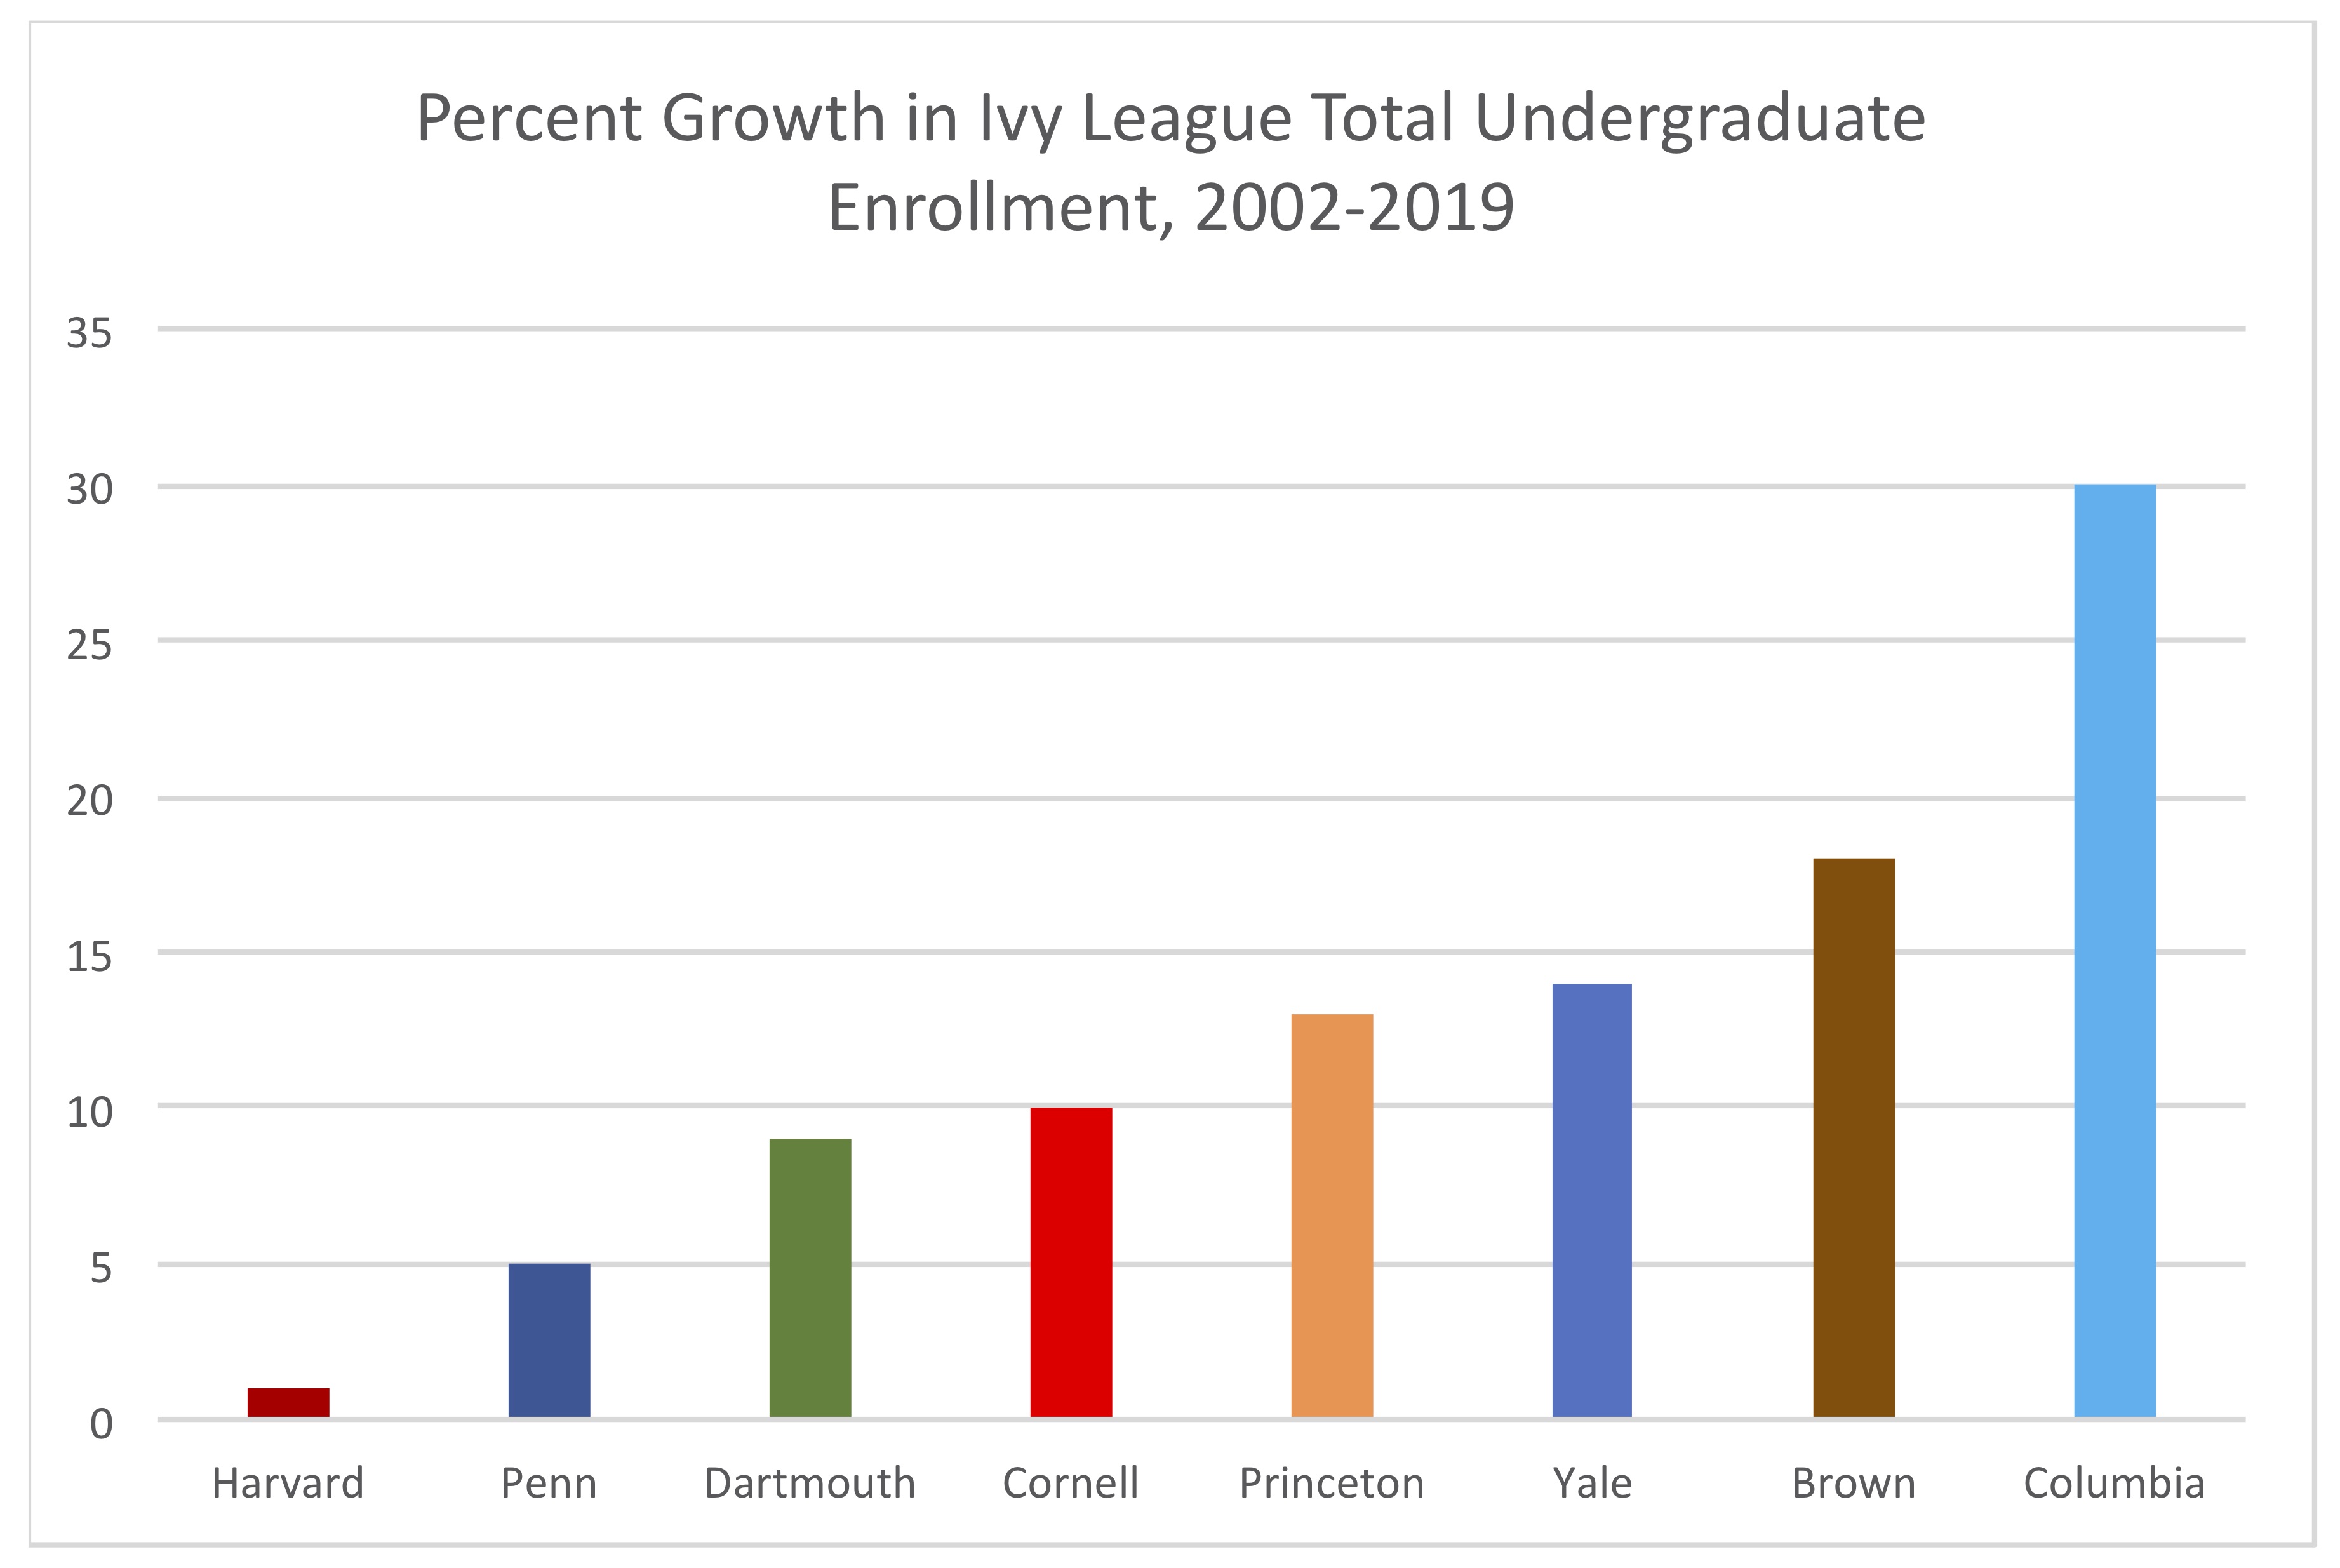
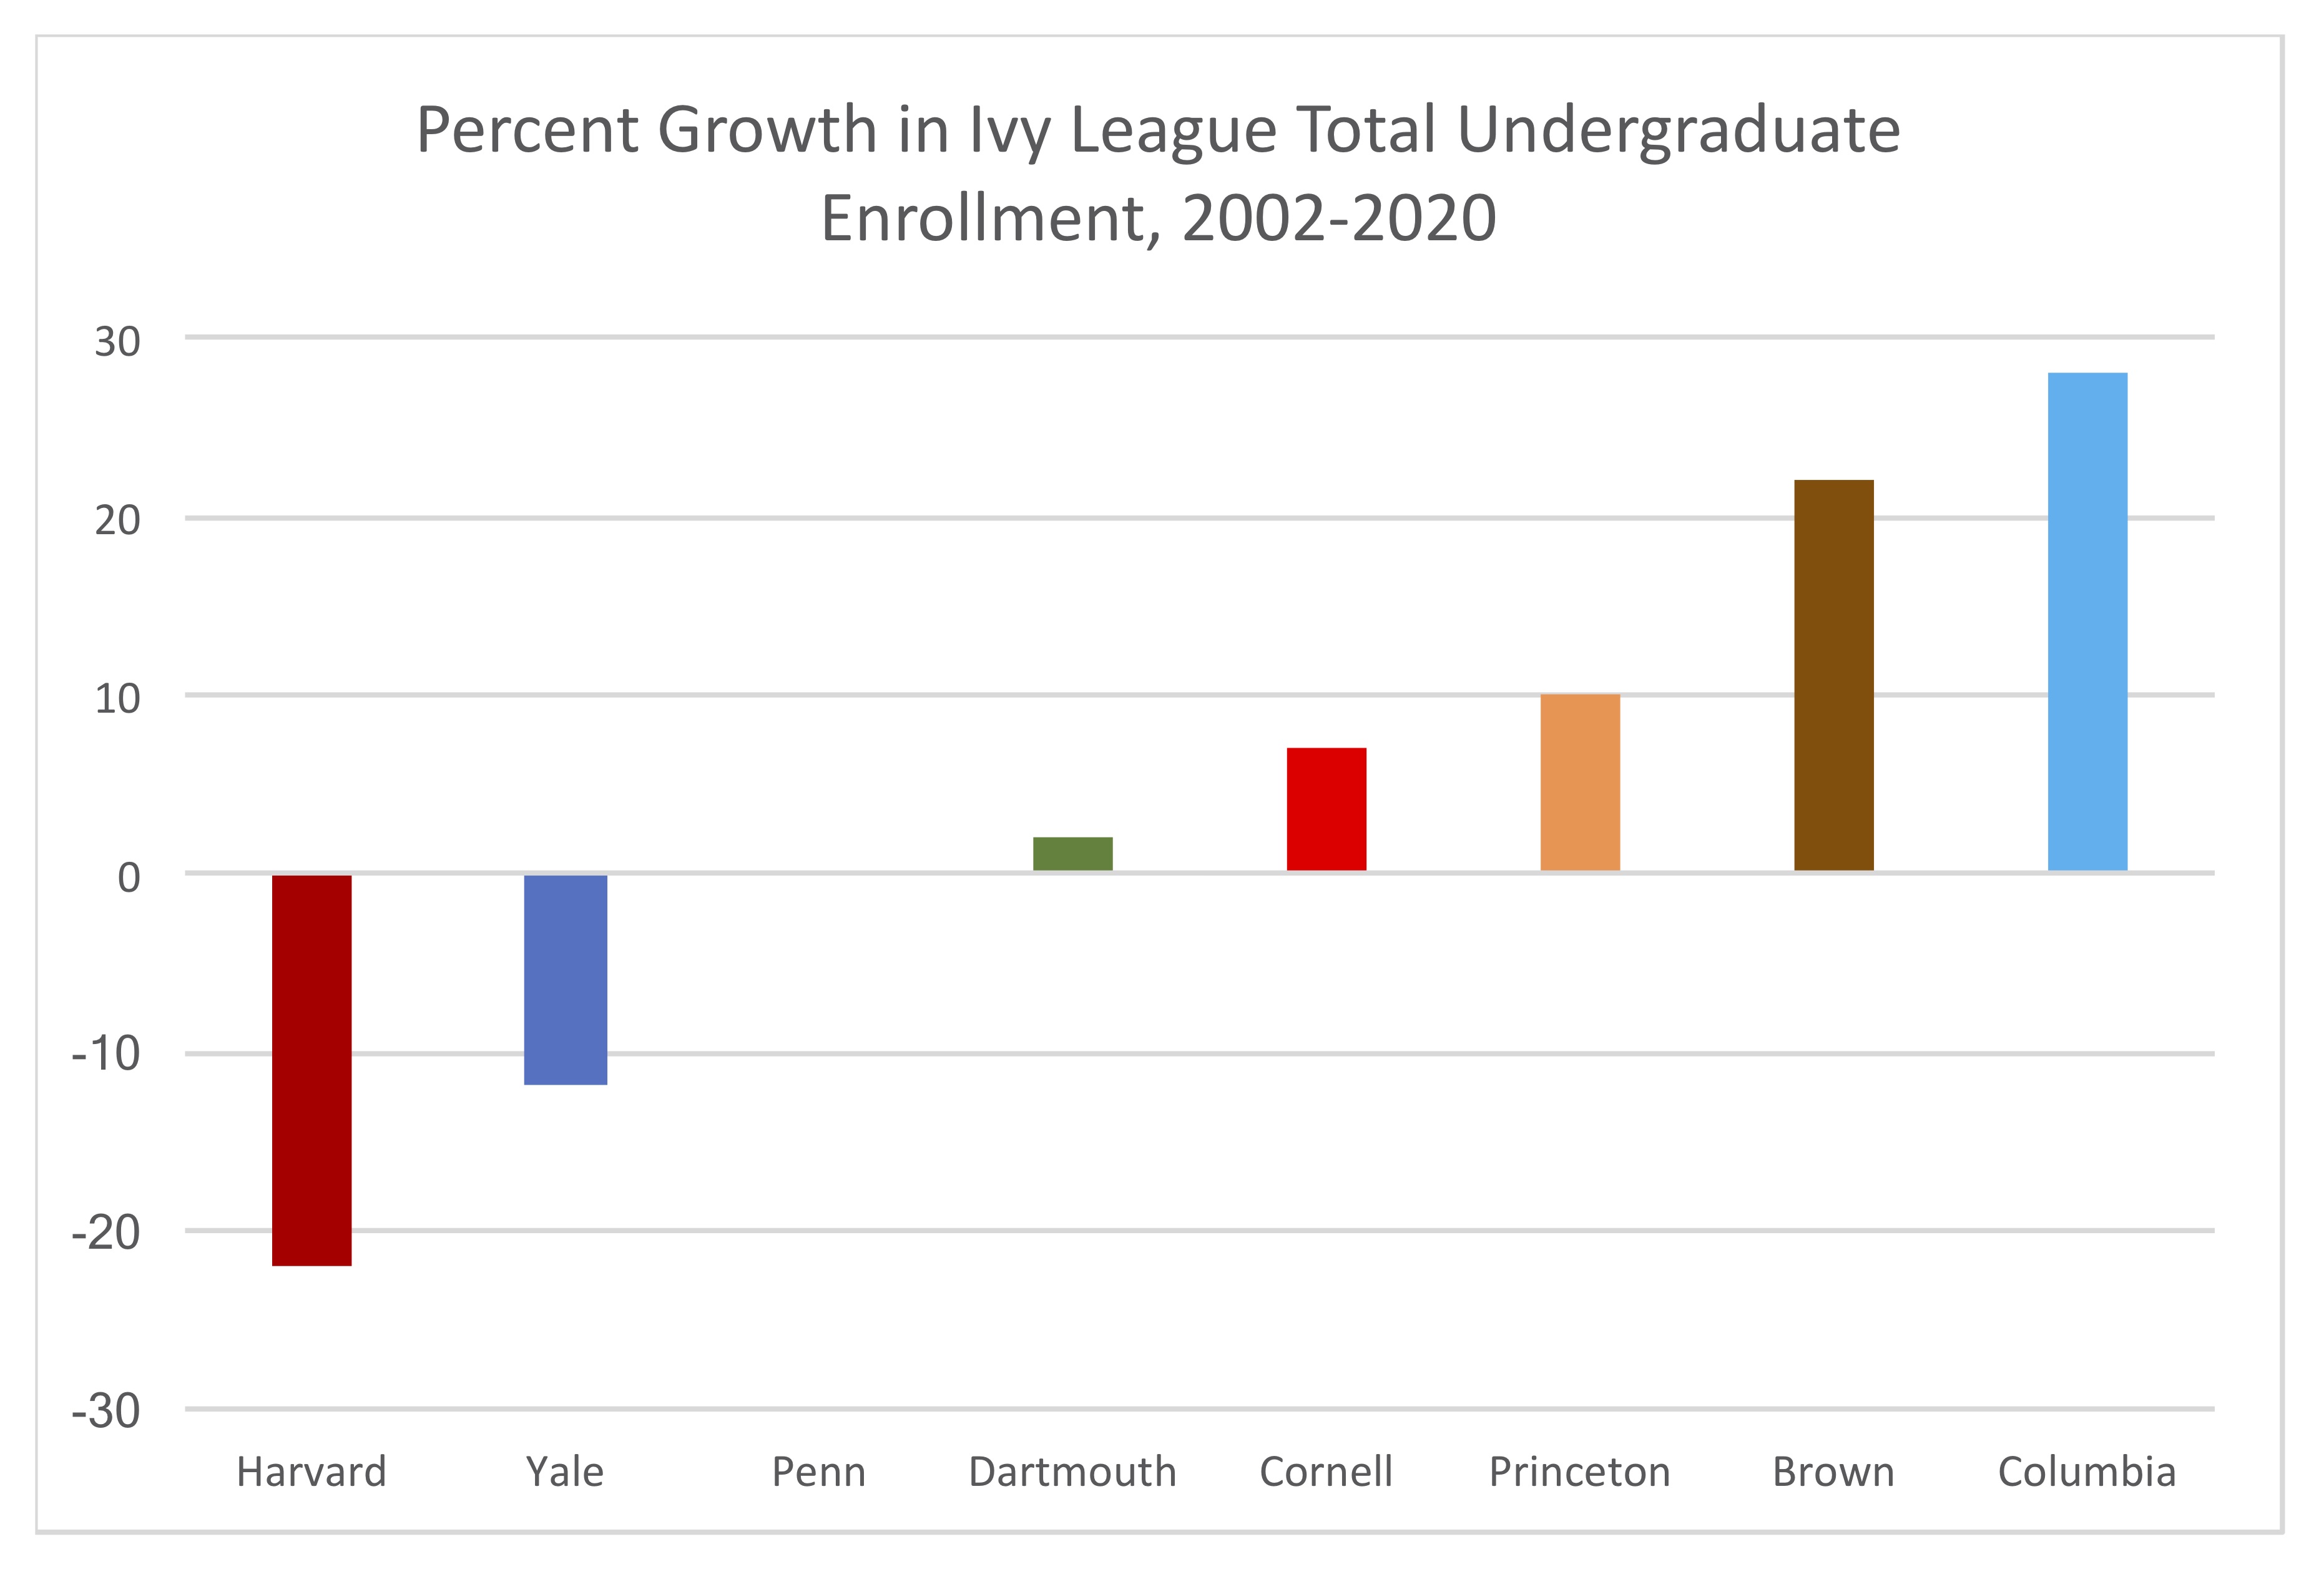
| Brown | Columbia | Cornell | Dartmouth | Harvard | Penn | Princeton | Yale | |
| 2002 | 5774 | 6929 | 13725 | 4084 | 6649 | 9917 | 4779 | 5339 |
| 2019 | 6820 | 9001 | 15043 | 4459 | 6716 | 10448 | 5422 | 6092 |
| 2020 | 7043 | 8842 | 14743 | 4170 | 5212 | 9960 | 5267 | 4703 |
| % Growth 2002-19 | 18 | 30 | 10 | 9 | 1 | 5 | 13 | 14 |
| % Growth 2002-20 | 22 | 28 | 7 | 2 | -22 | 0 | 10 | -12 |
Links to sources
Brown: https://oir.brown.edu/institutional-data/factbooks/historical-student-enrollment
Columbia 2002: http://web.archive.org/web/20040724184356/http://www.columbia.edu/cu/opir/abstract/2004EnrlHC.htm
Columbia 2019, 2020: https://opir.columbia.edu/sites/default/files/content/Statistical%20Abstract/opir_enrollment_history.pdf
Cornell: http://irp.dpb.cornell.edu/university-factbook/student-enrollment
Dartmouth: https://www.dartmouth.edu/oir/data-reporting/factbook/enrollment.html
Harvard 2002: https://oir.harvard.edu/historical-fact-books
Harvard 2019, 2020: https://oir.harvard.edu/fact-book/enrollment
Penn 2002: http://web.archive.org/web/20040419050607/http://www.upenn.edu/about/facts.php
Penn 2019: http://web.archive.org/web/20201031234037/https://www.upenn.edu/about/facts
Penn 2020: https://www.upenn.edu/about/facts
Note: Penn figures here refer to full-time undergraduates, as older headcounts of all undergraduates are not readily available.
Princeton 2002, 2019: https://registrar.princeton.edu/enrollment#datasets
Princeton 2020: https://www.princeton.edu/meet-princeton/facts-figures
Yale 2002: http://web.archive.org/web/20130524121437/http://oir.yale.edu/factsheet-archive
Yale 2019, 2020: https://oir.yale.edu/sites/default/files/w001_enroll_sum_2021_vf_111020.pdf