| Penn | Texas A&M | Michigan | California | Notre Dame | Northwestern | Columbia | |
| 2010 | 5668937 | 5738289 | 6564144 | 5441225 | 5234841 | 5945277 | 6516512 |
| 2011 | 6582029 | 6999517 | 7834752 | 6342217 | 6259598 | 7182745 | 7789578 |
| 2012 | 6754658 | 7638555 | 7691052 | 5962906 | 6329866 | 7118595 | 7654152 |
| 2013 | 7741396 | 8732010 | 8382311 | 6377379 | 6856301 | 7883323 | 8197880 |
| 2014 | 9582335 | 11103880 | 9731460 | 7384110 | 8039756 | 9778112 | 9223047 |
| 2015 | 10133569 | 10477102 | 9952113 | 7997099 | 8566952 | 10193037 | 9639065 |
| 2016 | 10715364 | 10539526 | 9743461 | 8341073 | 8374083 | 9648497 | 9041027 |
| 2017 | 12213202 | 11556260 | 10936014 | 9787627 | 9352376 | 10436692 | 9996596 |
| 2018 | 13777441 | 13524947 | 11901760 | 11008035 | 10727653 | 11087659 | 10869245 |
| 2019 | 14649762 | 13514528 | 12448817 | 11797543 | 11268365 | 11091516 | 10950738 |
| 2020 | 14877363 | 13594482 | 12476874 | 12141762 | 11962820 | 10926510 | 11257021 |
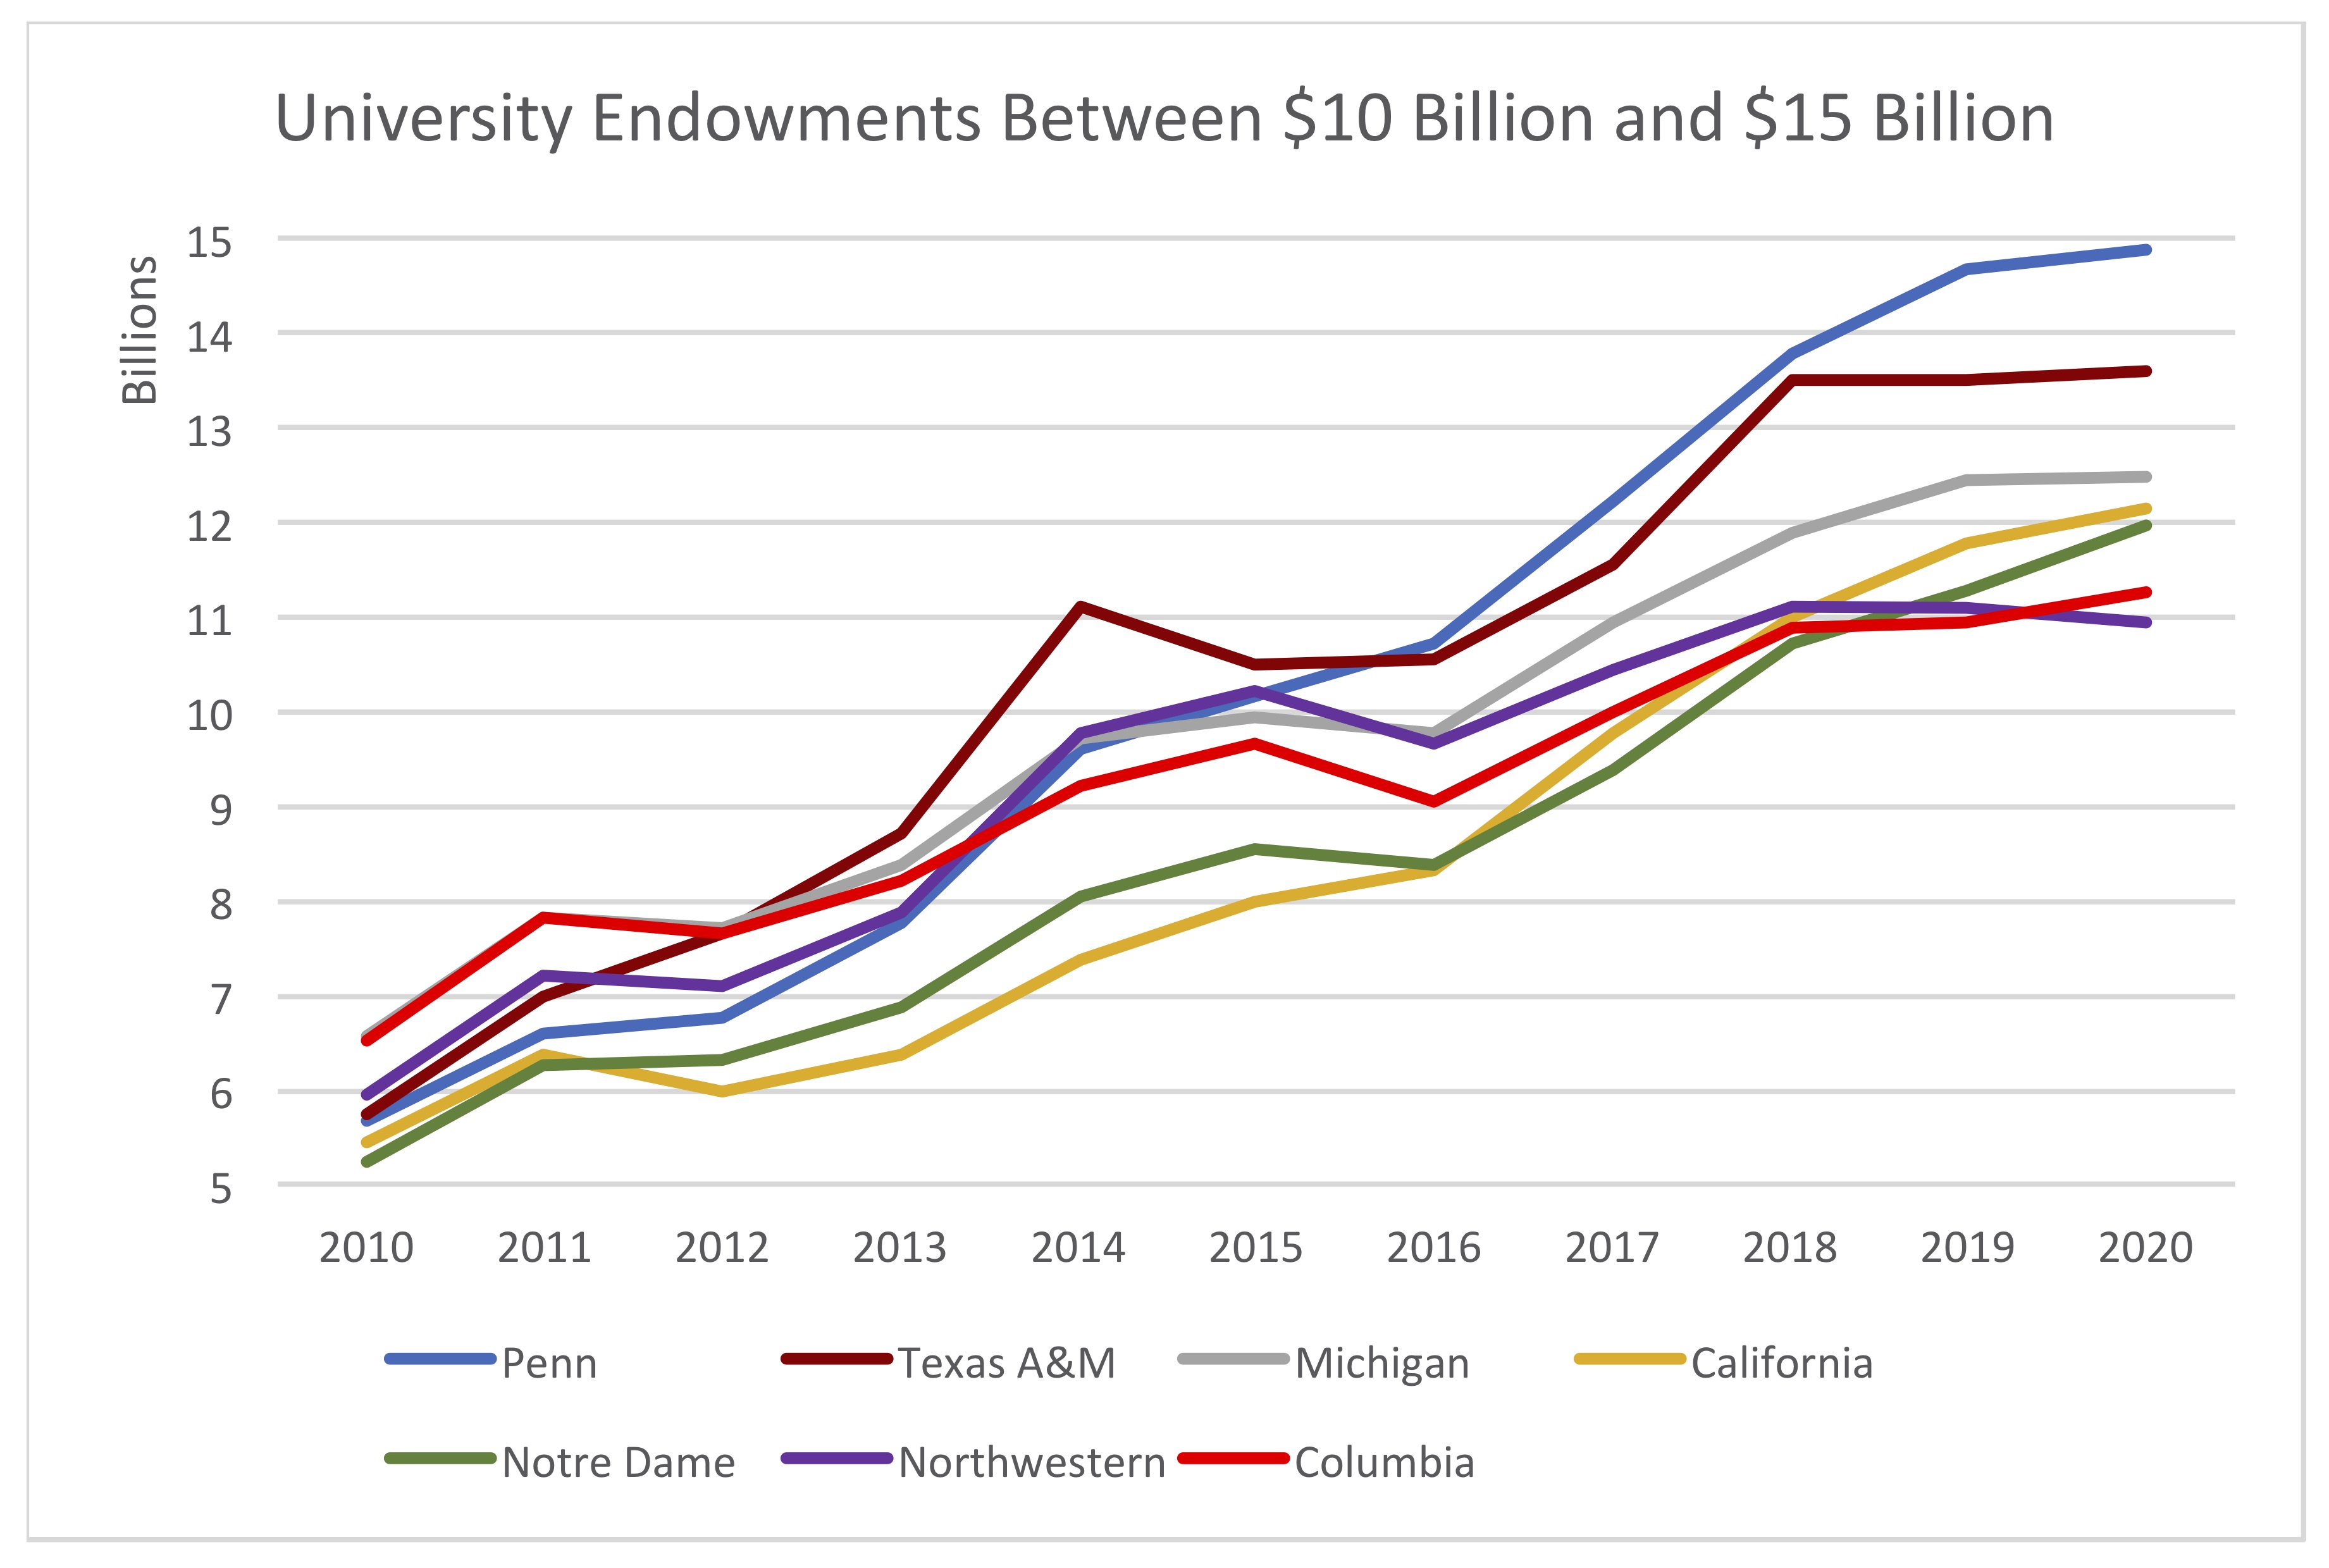
The endowments shown constitute the 7th through 13th largest university endowments in the United States as of 2020. (The six largest endowments, those of MIT, Princeton, Stanford, Yale, Texas, and Harvard, were valued between $18.5 billion and $40.6 billion in 2020.)
Figures are in thousands of dollars and represent endowment market value on June 30 of the year in question.
Source: NACUBO-TIAA Study of Endowments
Important note: The change in endowment market value from year to year does not reflect the return on investment alone. Indeed, Columbia's annualized 10-year return from 2010 to 2020 was 9.1%, while Penn's was only slightly larger at 9.3%. Yet, as the table shows, Columbia's endowment growth lagged by $4.47 billion behind Penn's during that period. Overall endowment growth is a combination of four quantities: (1) return on investment, (2) additions from gifts and contributions, (3) withdrawals for expenditures, and (4) management costs and fees. The latter three factors must explain the large discrepancy between Columbia's and Penn's endowment growth.
Chart compiled by Michael Thaddeus, Professor of Mathematics, mt324@columbia.edu