| Harvard | Cornell A+S | Dartmouth | CC | Princeton | Yale | Penn A+S | Brown | Barnard | GS (HC) | GS (FTE) | |
| 2002 | 6649 | 4390 | 4084 | 4141 | 4779 | 5339 | 6475 | 5774 | 2261 | 1485 | 888 |
| 2019 | 6716 | 4579 | 4459 | 4675 | 5422 | 6092 | 7567 | 6820 | 2682 | 2603 | 1998 |
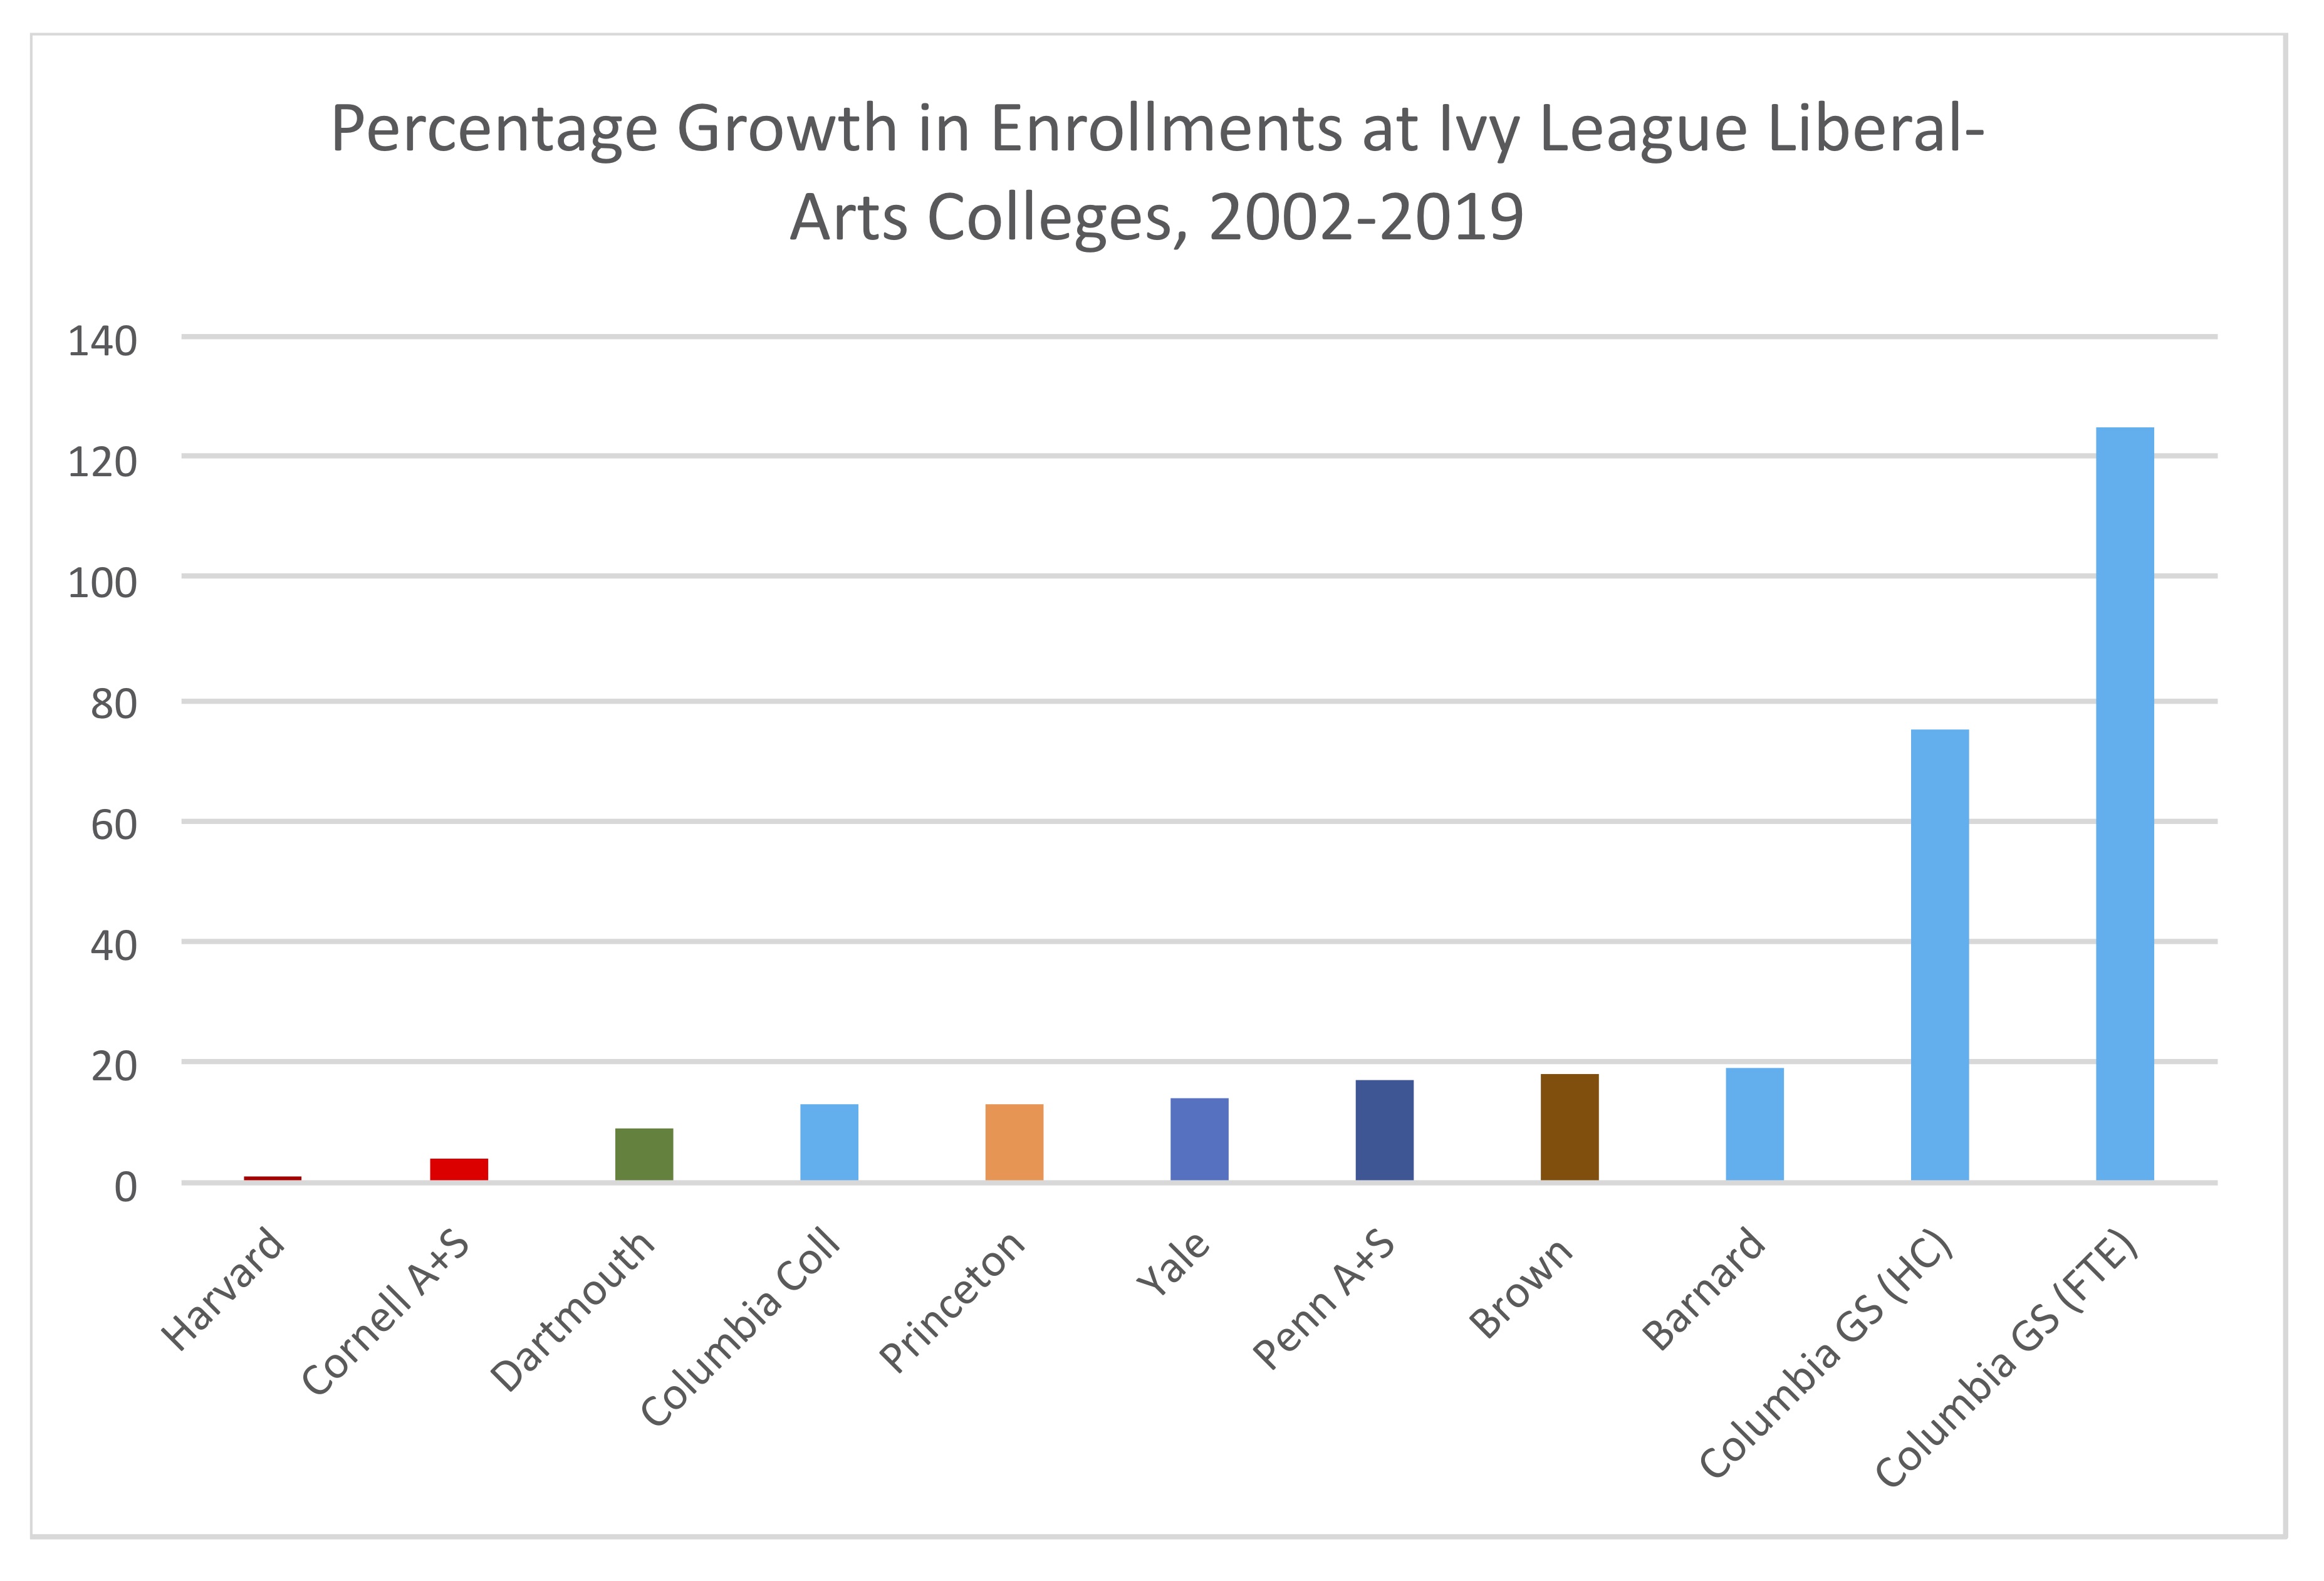
| % Growth | 1 | 4 | 9 | 13 | 13 | 14 | 17 | 18 | 19 | 75 | 125 |
Figures are headcounts of full- and part-time students, except for the last column, which gives full-time equivalents, and for the Penn data, which are headcounts of full-time undergraduates only. All are for the Fall semester.
2002 Sources
Barnard: http://web.archive.org/web/20030212121219/http://www.barnard.edu/about/facts.html
Brown: https://oir.brown.edu/institutional-data/factbooks/enrollment
Columbia: http://web.archive.org/web/20040620233539/http://www.columbia.edu/cu/opir/abstract/2003EnrlPTFT.htm
Cornell: http://irp.dpb.cornell.edu/university-factbook/student-enrollment
Dartmouth: https://www.dartmouth.edu/oir/data-reporting/factbook/enrollment.html
Harvard: https://oir.harvard.edu/files/huoir/files/harvard_fact_book_2002-2003.pdf
Penn: https://web.archive.org/web/20031205062240/http://www.upenn.edu/about/facts.php
Note: Penn figures here refer to full-time undergraduates, as older headcounts of all undergraduates are not readily available.
Princeton: https://registrar.princeton.edu/sites/g/files/toruqf136/files/2019-02/common_cds2002.pdf
Yale: http://web.archive.org/web/20130524121437/http://oir.yale.edu/node/530/attachment
2019 Sources: Same as Figure 1